Quality control is a very important technical work and basic management work in soil analysis. It is also the theoretical basis of the soil analyzer. The soil has a very complex matrix. The content analysis also includes the analysis of the total amount and the effectiveness (relative content). Therefore, the soil analysis has a wide range of content distribution, it is difficult to accurately determine, complex pre-processing and other characteristics. At present, soil analysis has not yet established a unified and effective quality control system. Although each soil analysis laboratory has its own set of quality control measures, it is far from perfect and systematic. Scientifically conducting quality control of soil analysis, improving the quality of soil analysis, and ensuring the accuracy and reliability of data are problems that should be solved by soil analysis laboratories. The soil analysis quality control includes internal quality control and external quality control. This article mainly discusses the internal quality control methods for soil analysis.
The internal quality control of soil analysis includes blank value test, calibration curve verification, periodical verification of equipment, double parallel analysis, spiked recovery test, use of standard or reference soil sample, and quality control chart control. Quality control specifically controls the accuracy and precision of soil analysis results.
1 The size and fractional degree of the blank value test results of the blank value test have a great influence on the accuracy and precision of the analysis results, and how the size and repeatability of the blank value reflect a considerable extent to a more comprehensive Soil analysts even the overall level of the laboratory. Pure water quality, purity of chemical reagents, cleanliness of glassware, technical status of analytical instruments, environmental pollution in the laboratory, and the level and experience of analysts all influence the determination of blank values. Since there are many factors that affect the blank value, and the size changes frequently, blank value tests should be performed at the same time for each soil sample analysis. Soil analysis projects differ in the size of the blanks, and their dispersion varies. Doing a blank test is not only the need for soil analysis, but also finding errors in the experiment to correct it in time.
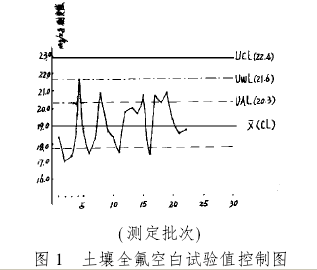
In order to effectively control the blank value test, blank value control charts are often used. The drawing of blank value control chart needs to accumulate more than 20 blank values ​​in batches. After statistics, the mean X-, standard deviation S is calculated and used as the auxiliary line (UAL) X-+S, upper warning line (UWL) X-+ 2S and upper control limit (UCL) X-+3S. The blank value control chart has no lower limit because the smaller the blank value, the better. For example, after multiple tests, the blank value of soil PFC determination was 22, and the statistics were X-= 19.0mg/kg, S=1.3mg/kg. According to the measured blank values ​​and statistical parameters, the blank value is plotted in Figure 1, in which 14 points are within the range of X+S, accounting for about 64% of the total points, approaching the theoretical value of 68%, and 7 consecutive points are not in the center. On the same side of the line, there is no point beyond the control limit, indicating that this blank value control chart is basically acceptable. Perform at least two blank parallel tests while performing soil batch analysis. If the blank value falls within the upper warning line, the blank test is in a controlled state. If it exceeds the upper warning line but remains within the upper control limit, the blank test value is indicated. Too high, check the factors related to the blank such as pure water and reagents. If the blank value exceeds the upper control limit, the blank test gets out of control, indicating that there is something wrong with a certain step or part. To stop the sample analysis, check one by one until the blank value is qualified. Sample analysis can be performed.
2 Drawing and application of soil standard or reference sample control and quality control charts
2.1 Use of Soil Standard or Reference Samples Soil sample samples or reference samples used in soil sample batch analysis and method studies are very effective methods for quality control. Soil standard samples generally have good stability and consistency, and their data are measured by a number of authoritative analytical laboratories using different test methods and advanced instruments, and obtained through scientific statistics. However, standard samples only have standard values ​​for stable chemical elements such as copper, zinc, lead, calcium, and magnesium, and they are expensive, so they are not suitable for use, and there are no such stable projects as organic matter, and readily available nitrogen and phosphorus. Change project. Therefore, soil analysis laboratories generally use soil reference samples as quality control samples because they are not as stringent as standard samples. In order to solve the nationwide soil census data collection, the National Soil Fertilizer Terminal has organized the soil reference samples jointly developed by several large-scale soil and fertilizer testing centers in the country to be commonly used in the analysis of soil samples collected from various provinces. Each lot must be taken as a reference sample during batch analysis. In general, there are 1 reference samples within 10 samples, 2 samples within 20 samples, and 3 samples over 20 samples. The value of the component to be measured of the reference soil sample used for quality control is preferably similar to the component value of the soil sample being tested. If soil samples have a wide range of values, two different reference soil samples should be used at the same time. The results of the reference soil analysis are within the control range, and the sample analysis results are generally acceptable. It is worth pointing out that the partial value of the reference soil sample is not very stable, especially for the fast-acting content. Therefore, according to the specific situation, the relevant collaborative analysis laboratory or different analysts should regularly organize the reassessment of the reference soil sample. reuse.
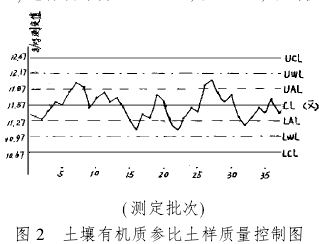
2.2 Drawing and Application of Quality Control Charts Reference soil samples were used as quality control samples. Each batch was analyzed simultaneously with the soil samples for quality control of soil sample analysis. The method is to draw the center line (X-) CL according to the reference soil sample setting; the upper and lower auxiliary lines (X-±S); UAL, LAL; upper and lower warning limits (X-±2S) UWL, LWL; , lower control limit (X-±3S) UCL, LCL. The quality control chart made according to the above method is called single value control chart. In the batch analysis, the results of each reference soil sample measurement point are on the quality control chart and are determined as follows: (1) If the measured value of the reference soil sample falls between UAL and LAL, the analysis process is under strict control; 2) If the measured value of the reference soil sample exceeds the UAL-LAL range, but is still between UWL and LWL, the sample analysis process is still in a controlled state; (3) If the measured value of the reference soil sample exceeds UWL-LWL However, within the UCL-LCL, the analysis process is also in a controlled state, but it indicates that the analysis quality is beginning to deteriorate, there may be a tendency to “run out of controlâ€, and the corresponding corrective measures should be checked and taken; (4) If the measured value runs out of UCL~ Outside the LCL, it indicates that the analysis process is completely out of control and the cause should be immediately identified. The results of the analysis of all the soil samples in this batch are invalid and should be redone. (5) If there are 7 consecutive drops, rises or on the same side of the centerline, then Indicates that there is a tendency to go out of control and should be identified and corrected. During the use of the quality control chart, the control line of the quality control chart should be adjusted based on the new data of the reference soil sample, and the quality control chart should be redrawn. For example, the reference value of the organic content of the 1# salt and soil reference developed by the soil survey is 11.5mg/kg±1.2, and the dispersion degree is obviously too large, which is not suitable for controlling the analysis quality. According to the new test data of the reference soil sample (n>30), the statistics are X- = 11.57, S = 0.30, the average value is close to the original value, but the standard deviation is much smaller. Re-render the quality control chart 2, centerline, The auxiliary lines, warning limits and control limits have been adjusted accordingly, resulting in improved control accuracy. After statistical analysis of 50 batches of actual results, there are 41 points between the upper and lower auxiliary lines, accounting for 82%, and the remaining 8 points are within the upper and lower warning limits, and do not exceed the upper and lower control limits. Explain that the analysis quality is under effective control.
3 parallel double sample test Parallel double sample test is a common method for measuring analytical precision, it is the main indicator of the accidental error of the analytical results, expressed as parallel relative phase difference or absolute phase difference. Since the analysis of bulk soil samples cannot be repeated as many times as several times as research work, it is generally sufficient to use two-sample parallel analysis to meet the control requirements. In the case of 100% double-sample parallel analysis, if the difference exceeds the specified value, the soil sample that exceeds the specified value shall be re-analyzed. If some samples are analyzed in parallel, if there is any unqualified sample, in addition to re-analyzing the soil sample that has been rejected by the difference, Plus analysis of more than 20% of the parallel double. Due to the different methods of analysis of soil projects, the difficulty varies, and the content changes greatly, the standard for the difference in the method is not the same. Each soil analysis laboratory can refer to the “Soil Analysis Technical Specifications†prepared by the National Soil Fertility Station and published by the Agricultural Press to implement the soil analysis laboratory according to their specific conditions.
4 Spiking Recovery Tests Spiking recovery is a commonly used method to determine the accuracy of analysis. In particular, the accuracy and reliability of the method must be measured using the spiked recovery test in the analysis and application of new methods, new technologies, and new instruments. The spike recovery test is also commonly used in soil routine analysis. It is very important for an experienced analyst to frequently use the spike recovery test to test the accuracy of their own soil analysis, especially if there is no standard soil. When using samples or reference soil samples, it is particularly important to use the spike recovery test. The method for spike recovery test is to take several identical soil samples. Some of them were added with a known amount of the standard substance to be tested, and their contents were analyzed under the same conditions to calculate the recovery rate. Recovery rate = (mean value of spiked standard - average soil sample content)/standard material added value × 100%. The standard addition recovery test should pay attention to: (1) The amount of spiking should be as close as possible to the content of the component to be tested in the sample; (2) In any case, the amount of spiking should not be greater than 3 times the amount of the component to be tested in the soil sample; (3) Addition The total measured value after the mark must not exceed the upper limit of the method detection. The qualification requirements for the spiked recovery are determined according to different methods and different levels of content. Generally speaking, the target value is 95% to 105%. The method is difficult, the procedures are cumbersome, the content level is low, the project can be relaxed to 90% to 110%, and individual trace elements and special items can even be relaxed to 80% to 110%. Mainly relax at the lower limit.
The quality of soil analysis is a reflection of the analysis method itself, the technical level and experience of the operators, the condition of the instrument technology and the comprehensive factors of the laboratory technology management. The soil analysis quality control methods described above have some emphasis on the accuracy and precision control of the soil analysis results. The soil analysts take a comprehensive application of various quality control measures and alternately perform the soil analysis quality control automatically. To ensure that the quality of the analysis meets the eligibility requirements, even if there are accidental errors, it can be corrected in time.
Soil Instruments: Soil Analyzer Soil moisture temperature tester Soil temperature and humidity recorder
----FOR NPR
Differential Gear Development,Tractor ,Forklift ,Dump Truck
Transit Parts,Brand Parts Co., Ltd. , http://www.nbtransitparts.com